Published: June 11, 2026 — Post-WASDE Edition Author: F. Garcia Blog — Commodity Market Intelligence Category: Grain & Pulse Crop Market Analysis
⚠️ WASDE Update — June 11, 2026: The June 2026 WASDE report (WASDE-672) is out. USDA left U.S. 2026/27 corn ending stocks virtually unchanged at 1.960 billion bushels while revising global corn carryout higher to 281.2 MMT — up 3.7 million tons from May. The tightening narrative is gone. The base case is bearish heading into summer.
What Did the June 2026 WASDE Report Say About Corn?
The June 2026 WASDE report delivered exactly what bears needed and bulls feared — a confirmation. USDA’s WASDE-672, released June 11, made virtually no changes to the U.S. corn balance sheet while simultaneously revising global corn carryout higher. For grain traders, dry bean growers, and agricultural merchandisers tracking this market, here is the complete post-WASDE breakdown.
✅ June 2026 WASDE Report: Key Numbers vs. May
The three numbers driving the market reaction to the June 2026 WASDE report — straight from the official WASDE-672 tables:
| Metric | May WASDE | June WASDE | Change | Verdict |
|---|---|---|---|---|
| U.S. 2026/27 Corn Ending Stocks | 1.957B bu | 1.960B bu | +3M bu | 🔴 Bearish — virtually unchanged, near 7-yr high |
| Global Corn Carryout | 277.5 MMT | 281.2 MMT | +3.7 MMT | 🔴 Bearish — stocks rising, tightening narrative removed |
| U.S. Corn Season-Avg Farm Price | $4.40/bu | $4.40/bu | Unchanged | 🟡 Neutral |
| U.S. 2026/27 Soybean Ending Stocks | 310M bu | 310M bu | Unchanged | 🟡 Neutral |
| Soybean Farm Price 2026/27 | $11.40/bu | $11.40/bu | Unchanged | 🟡 Neutral — still competitive vs. dry beans |
| Global Wheat Ending Stocks | 275.0 MMT | 275.4 MMT | +0.4 MMT | 🟡 Neutral |
Corn Futures: The June 2026 WASDE Report Confirmed the Bear Case
Why Did Corn Prices Fall So Fast in 2026?
Corn futures peaked at $5.045 per bushel on May 4, 2026 — the highest price since late 2023. That rally was driven by the Iran conflict, fertilizer cost spikes, and speculative fund buying. Once ceasefire talks progressed and Corn Belt weather forecasts improved, the premium collapsed fast.
As of June 9, 2026, heading into the June 2026 WASDE report:
- July corn futures settled at $4.19½ per bushel
- December corn futures hovering near $4.45½ — the 1.0 Fibonacci retracement level and the last technical support shelf before a potential drop to $4.29
- The October 2025 uptrend line broken and confirmed as resistance
What Did WASDE-672 Add to the Picture?
The June 2026 WASDE report confirmed what the charts had been signaling for weeks. USDA described the 2026/27 corn outlook as “virtually unchanged relative to last month,” with only fractional adjustments to beginning and ending stocks.
More critically, global corn carryout was revised higher from 277.5 MMT in May to 281.2 MMT in June — driven by production increases for India, Brazil, Argentina, and Paraguay. The May narrative of a “13-year low” in global stocks has been revised away. That was one of the last remaining fundamental pillars supporting the bull case.
For broader context on how the June 2026 WASDE report compares to prior months, see the USDA’s official WASDE archive.
What Are the Bearish Factors Pushing Corn Lower?
- U.S. corn planting is 93% complete, ahead of the five-year average, with crop emergence at 76%
- USDA crop condition ratings at 67% good-to-excellent, slightly below last year’s 69%
- Above-normal rainfall forecast across the Corn Belt for the next two weeks
- Global corn carryout revised to 281.2 MMT in the June 2026 WASDE report — up 3.7 MMT from May. See USDA Foreign Agricultural Service export data for current shipment figures.
- China has not confirmed corn purchases despite political signals in mid-May
- Managed money funds still hold significant net long exposure with further liquidation risk remaining
What Is the One Bullish Risk This Summer?
Corn pollination does not occur until mid-to-late July. A forecast shift showing a heat ridge over the Corn Belt in July could trigger a violent short-covering rally back toward $4.75–$5.00 or higher. That tail risk is real even as the fundamental base case is now more clearly bearish post-WASDE. Track the latest 8–14 day outlooks at NOAA’s Climate Prediction Center.
Revised Price Outlook — Post-June 2026 WASDE Report Scenarios
| Scenario | Probability | December Corn Target | Trigger |
|---|---|---|---|
| Bear — Trapdoor Opens | 60% | $4.29–$4.35 | June 2026 WASDE confirmed ✅ + favorable Corn Belt weather + continued fund liquidation |
| Neutral — Grinding Sideways | 25% | $4.40–$4.60 | Mixed weather signals + China begins buying slowly |
| Bull — Squeeze/Weather Rally | 15% | $4.75–$5.00+ | July drought signal OR confirmed large-scale Chinese corn purchases |
The bear probability rises from 50% to 60% following the June 2026 WASDE report. The fundamental floor is now weaker.
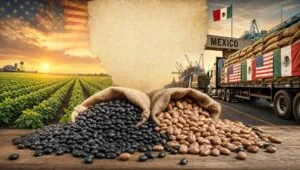
Dry Bean Market 2026: Acreage Pressure Confirmed by June WASDE Report
Why Is Dry Bean Acreage Declining in 2026?
The biggest structural threat to dry bean production in 2026 is competition from soybeans — and the June 2026 WASDE report made it official. USDA held the 2026/27 soybean farm price at $11.40 per bushel with ending stocks unchanged at 310 million bushels. Growers with flexible swing acres have no new financial reason to shift back toward dry beans.
Dylan Karley, General Manager of Johnstown Bean Company, has publicly stated he expects a noticeable decline in edible bean acreage in 2026 as a direct result of this soybean price competition. Today’s WASDE did nothing to change that calculus. For broader context on pulse crop dynamics, review the latest USDA NASS Crop Progress data.
Where Does Dry Bean Planting Stand Right Now?
As of late May 2026, U.S. dry bean planting was running at only 27% of intended area — compared to 46% last year and a five-year average of 40%. The largest seeding lag of any pulse crop this season.
By the June 8 NASS Crop Progress report, significant acceleration had occurred:
| State | Dry Bean Planted (June 8, 2026) |
|---|---|
| North Dakota | 64% |
| Minnesota | 76% |
| Montana | 74% |
| Nebraska | 41% |
| Colorado | 17% |
| Michigan | 16% |
North Dakota remains the largest intended production state at 510,000 acres, followed by Minnesota at 270,000 acres.
Bottom Line for Bean Growers: Expect localized price strength in black and pinto beans driven by the late planting start and Brazil’s crop damage — but that upside is capped by the soybean ceiling. As long as soybeans hold at $11.40/bu with no USDA revision, growers with flexible acres have little financial incentive to shift back to dry beans. The June 30 Planted Acreage report will be the first hard confirmation of how many acres actually went into the ground.
What Is Supporting Dry Bean Prices Despite the Acreage Risk?
Two international factors continue to provide a price floor for dry beans — both short-term in nature:
- Brazil’s colored bean crop has been damaged by frost and rain, creating quality and yield shortfalls that have increased import demand for black and colored beans from Argentina.
- Strait of Hormuz shipping: Progress in Iran ceasefire negotiations has raised hopes for normalization of shipping lanes, which would ease freight and energy cost pressures across global commodity markets.
Why Is Long-Term Consumer Demand for Dry Beans Growing?
The two factors above are short-term price catalysts tied to a single crop cycle. Underneath them runs a longer-term structural demand story that matters just as much for anyone positioned in this market over a multi-year horizon — and it moves independently of what corn or soybeans do in any given season.
Dry bean demand is accelerating at the consumer level. As food prices rise, Americans are returning to beans as a low-cost, high-nutrition protein alternative — and that trend does not reverse when corn goes bearish or soybeans attract swing acres. It compounds. Key data points that define this structural tailwind:
- A single can of beans costs approximately $1 and delivers 3.5 servings of protein comparable to beef, per research published in The Journal of Nutrition
- CSU researcher Dr. Henry Thompson recommends a “therapeutic amount” of 1.5 cups per day to maximize gut health and disease-prevention benefits — a data point driving increased institutional interest from food manufacturers and restaurant chains alike
- The global dry beans market was valued at $7.2 billion in 2024 and is projected to reach $10 billion by 2033, growing at a 3.7% CAGR, driven by the global shift toward plant-based protein
The near-term price picture is complicated by soybean competition and planting uncertainty. The long-term demand picture is not — it is one of the cleaner structural growth stories in specialty crops. Bean growers navigating a difficult 2026 season are doing so with a favorable demand tailwind behind them.
For more on dry bean nutrition and consumer trends, visit the Bean Institute.
USDA ASCF Program 2026: $1.625 Billion — August 7 Deadline Approaching
The Assistance for Specialty Crops Farmers (ASCF) program is open for enrollment. USDA is distributing $1.625 billion to eligible specialty crop producers in response to elevated input costs and market disruptions caused by foreign trade practices that impeded U.S. specialty crop exports.
Enrollment details:
- Online applications: Available starting June 1, 2026 (Login.gov account required)
- In-person FSA enrollment: Available starting June 8, 2026
- Program deadline: August 7, 2026
Dry bean growers should contact their local USDA Farm Service Agency office or visit the ASCF program page to verify eligibility before the August deadline.
North Dakota Cropland Values 2026: Post-Boom Plateau
After four consecutive years of double-digit growth, North Dakota cropland values have largely stalled at +0.88% statewide for 2026, according to NDSU Extension data.
Regional variation was wide:
- North Central: +8.1% | Northwest: +5.9% | South Central: +4.8%
- Southeast: -7.5% | Southwest: -3.1% | Northeast: -0.9%
Statewide rental rates increased 2%, with North Central leading at +8.2%.
Post-WASDE June 2026 Market Summary
| Market | Signal | Outlook |
|---|---|---|
| 🌽 June 2026 WASDE Report — Corn | Stocks unchanged; global carryout revised higher to 281.2 MMT | Bear base case now 60%; July weather is the only wildcard |
| 🌍 Global Corn Carryout | Up from 277.5 MMT to 281.2 MMT | “13-year low” narrative removed; bearish |
| 🫘 Dry Beans | Planting recovered but late; soybean price confirmed at $11.40/bu | Localized strength possible; soybean ceiling intact |
| 💰 USDA ASCF Program | $1.625B for specialty crop producers | Deadline August 7 — act now |
| 🌱 North Dakota Land | Post-boom stall at +0.88% statewide | Wide regional swings; thin market volume |
| 📦 Soybean Prices | Held at $11.40/bu by June 2026 WASDE report | Competitive pressure on dry bean acres confirmed |
What Comes Next: Mark Your Calendar
- June 30, 2026 — USDA Planted Acreage Report: The most important data release of the summer. Confirms actual planted acres for corn, soybeans, and dry beans. Could reset price trajectories in all three markets.
- July 10, 2026 — Next WASDE: First report to incorporate crop condition data through the early pollination window. Weather between now and then is everything.
FAQ: June 2026 WASDE Report
What did the June 2026 WASDE report show for corn?
WASDE-672 left U.S. 2026/27 corn ending stocks virtually unchanged at 1.960 billion bushels. Global corn carryout was revised higher to 281.2 MMT from 277.5 MMT in May. The season-average corn price forecast remained unchanged at $4.40/bu.
What is the current price of December 2026 corn futures?
As of June 9, 2026, December corn futures were near $4.45½ per bushel, down from the May 4 high of $5.045. The June 2026 WASDE report provides no fundamental catalyst for a price recovery.
When is the next WASDE report after June 2026?
The next USDA WASDE report is scheduled for July 10, 2026 at 12:00 PM ET — the first report to incorporate updated crop condition and weather data through the early corn pollination window.
What is the USDA ASCF program and who qualifies?
The ASCF program provides $1.625 billion in relief to eligible specialty crop producers, including dry bean growers. Enrollment closes August 7, 2026.
Why are dry bean acres declining in 2026?
Soybean prices — confirmed at $11.40/bu in the June 2026 WASDE report — continue attracting swing acres away from dry beans. No change to soybean economics means competitive pressure on dry bean acreage remains fully intact.
What would cause corn futures to rally despite the bearish June 2026 WASDE report?
A confirmed drought signal or July heat stress during the corn pollination window is the primary rally catalyst. Confirmed large-scale Chinese corn purchases would be the second trigger. Neither has materialized as of this report.
Sources: USDA WASDE-672 (June 11, 2026) · NBGA June 2026 Newsletter · USDA NASS Crop Progress Reports (May–June 2026) · USDA Export Inspections (week ending June 4, 2026) · Columbia Grain Pulse Market Report (May 2026) · Brownfield Ag News (June 9, 2026) · Farm Futures (June 9–11, 2026) · AgWeb (June 8–11, 2026) · Barchart.com (June 2026) · USDA ERS Soybeans & Oil Crops Outlook · NPR All Things Considered · IMARC Group Dry Beans Market Forecast 2024–2033 · NDSU Extension Agricultural Finance (Bryon Parman, 2026)Oil Crops Outlook · NPR All Things Considered — “When times are hard, we eat more beans” · IMARC Group Dry Beans Market Forecast 2024–2033 · NDSU Extension Agricultural Finance (Bryon Parman, 2026)